Highlights from Q4 2022
- In the fourth quarter of 2022, one-half (49%) of RI funds outperformed the average return for their respective asset class category. Last quarter, this proportion was about 60%.
- Net asset flows to Canadian-domiciled RI funds in the fourth quarter of 2022 remained positive at $660 million. This was a 164% increase from the previous quarter.
- This quarter, only 1 new RI product was launched, which was a mutual fund. Year-to-date 2022, 45 new RI products have been launched.
RI Fund Performance
- Based on data provided by Morningstar, in Q4 2022 49% of Canadian-domiciled RI products outperformed the average return for their respective asset class. For the 12 months ending December 31st, 2022, just 21% of Canadian RI products outperformed their respective average asset class return.
- Over the medium term, 42% of Canadian-domiciled RI products outperformed the average return for their respective asset class over the 3 years ending December 31st, 2022, as did 42% over the 5-year period.
- The following information highlights RI fund performance for notable asset classes, in Q4 2022 and over longer time periods.
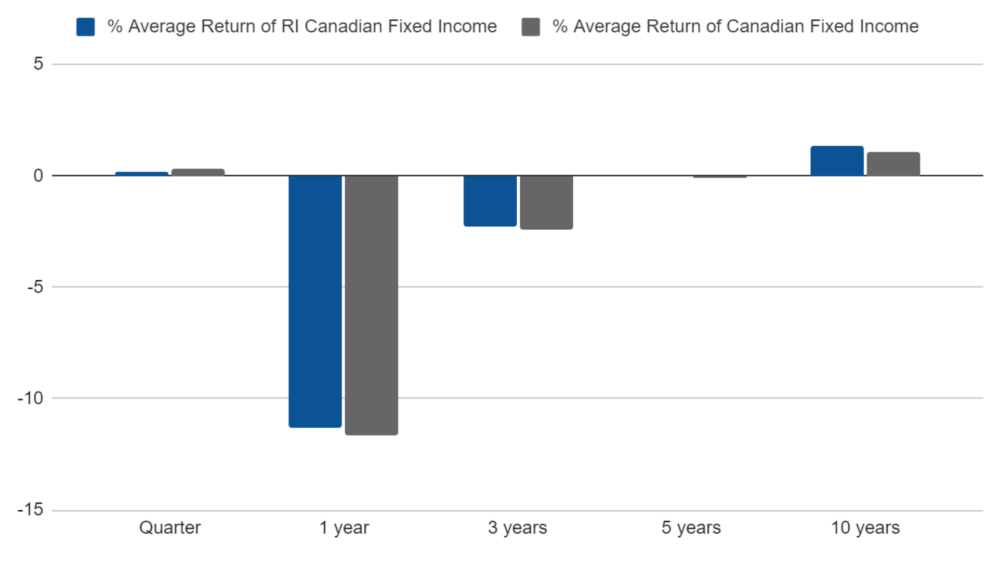
Canadian Fixed Income
For the Canadian Fixed Income fund class, 54% of RI Canadian Fixed Income products outperformed the average for the asset class in the fourth quarter of 2022. This quarter, the average RI product slightly underperformed the average for the asset class. For all other time periods examined in this report, the average RI product outperformed its asset class counterpart.
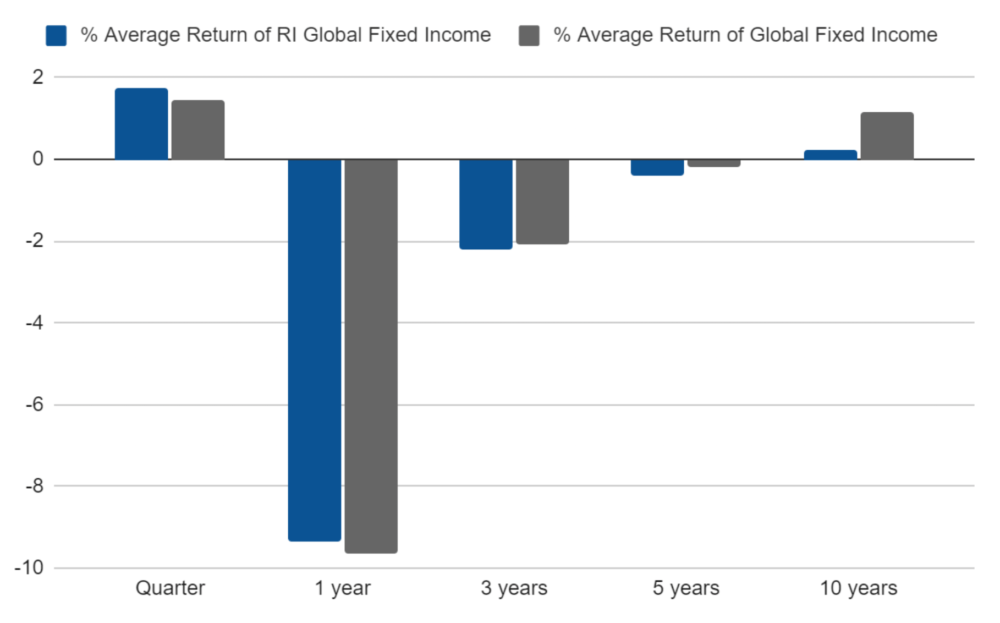
Global Fixed Income
For the Global Fixed Income fund class, in the fourth quarter of 2022, 57% of RI funds outperformed the average asset return for the category. For the 12 months ending December 31st, 2022, the average RI fund outperformed the category average. Over the 3, 5, and 10 year periods reviewed in this report, the average RI fund just slightly underperformed the category average.
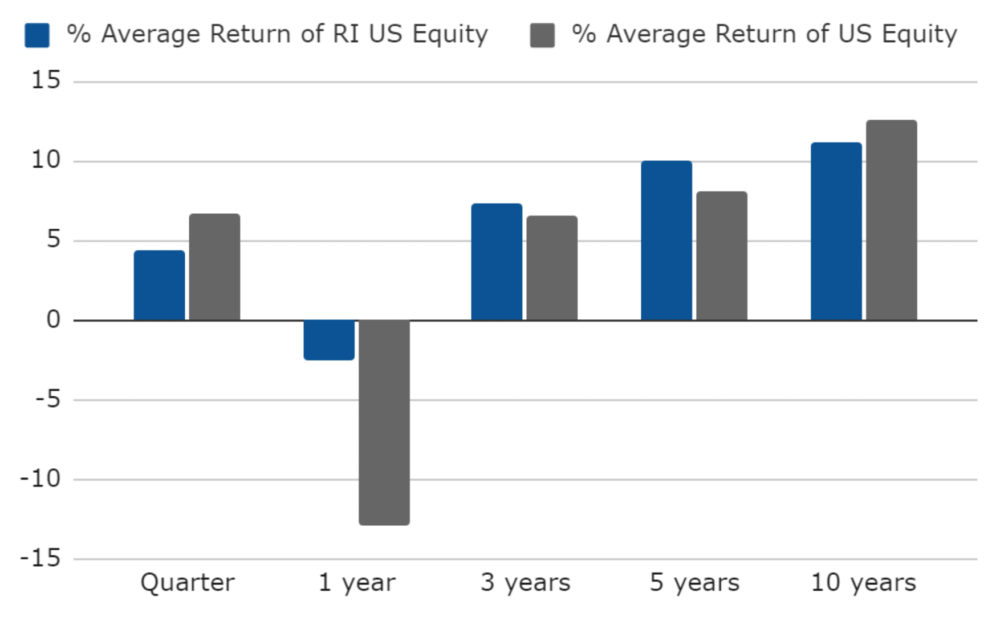
US Equity
For the US Equity fund class, 69% of RI funds outperformed the average asset class return in the fourth quarter. For the previous 1, 3, and 5 years the average RI product outperformed the asset class average, and for the previous 10 years the average RI product just slightly underperformed the asset class average.
Note: For the purpose of this report, RI funds include those that are marketed as responsible investments with RI strategies/policies disclosed in regulatory documents. Average asset class return includes RI and non-RI funds. Returns for periods greater than one year are annualized. Excludes fund-of-funds.
RI Fund Flows
Net asset flows into RI mutual funds and ETFs were positive this quarter at approximately $660 million, a significant increase from the third quarter net assets flows of $250 million. Both passive and active strategies had positive inflows in the fourth quarter, with active strategies representing about 90% of the total inflows. For the full year, net asset flows into RI funds totaled $5.1 billion, compared to $12.8 billion in all of 2021.
Canadian RI Mutual Fund and RI ETF Net Flows
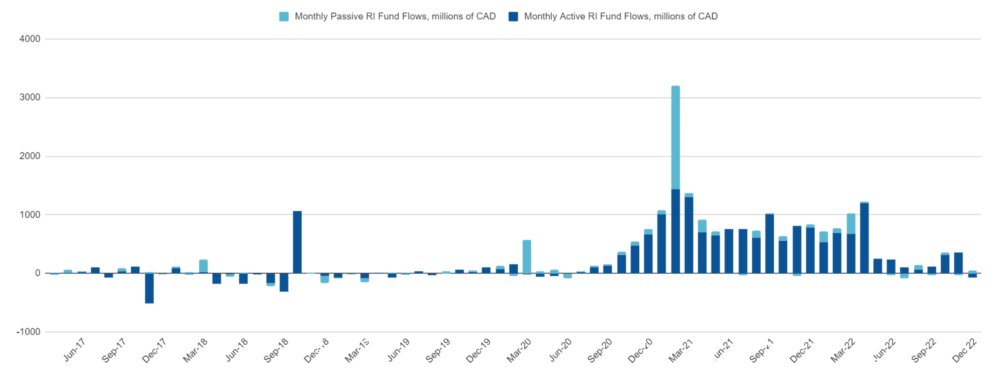
Source: Morningstar Direct. Data as of December 31st, 2022. Excludes funds of funds.
RI Product Launches
Based on information from Morningstar, RI product launches slowed down significantly from the previous quarter. In Q4 2022, only 1 new product was launched, which was a mutual fund. In 2022 in total, 45 new RI products have been launched, compared to 50 in 2021.
Canadian RI Mutual Fund and RI ETF Launches
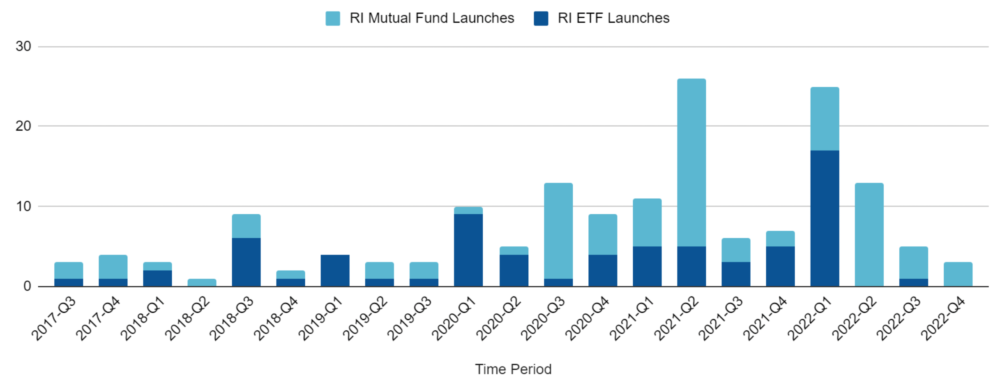
Source: Morningstar Direct. Data as of December 30th, 2022.
Download Q4 2022 Highlights PDF.
RIA Members can download the full report by logging in to their account and accessing Member Resources.
Data provided by
![]()
©2022 Morningstar. All Rights Reserved. The information contained herein: (1) is proprietary to Morningstar and/or its content providers; (2) may not be copied or distributed; and (3) is not warranted to be accurate, complete or timely. Neither Morningstar nor its content providers are responsible for any damages or losses arising from any use of this information. Past performance is no guarantee of future results.
Disclosure
The information contained in this report is for educational and general information purposes only. The information contained herein does not constitute advice nor does it constitute an offering of securities or any advertisement for the offering of securities. You should not act or rely on the information without seeking professional advice. While we believe the information to be reliable [and endeavour to keep the information up to date and correct], we make no representations or warranties of any kind, express or implied, about the completeness, accuracy, reliability, timeliness, suitability or availability with respect to the report or the information, products, services or related graphics contained in the report for any purpose. The RIA does not endorse, recommend or guarantee any investment products listed in the report.